ERNESTO—SOFTWARE.
EN ES
01.04 Engagements Own product · sports data Remote
← Engagements

A prediction model that publishes the 618 games it told you to skip

I built the model, the application around it, and the pipeline that feeds it. Three people pay for it. What I would show another engineer is not on the pricing page: it is the harness that scores a shadow model against the live one, game by game.

DailyMoneyball
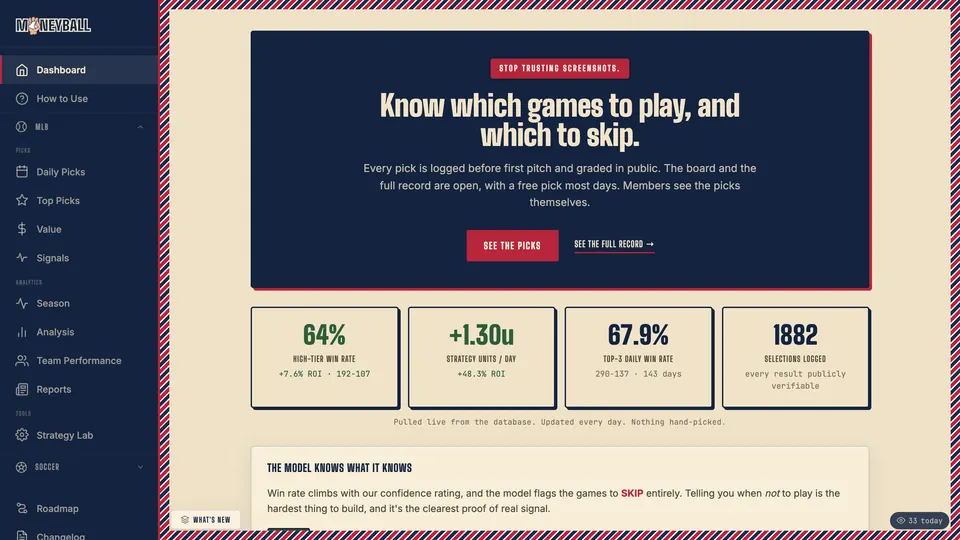
Fig. 01. The board, with the high, medium, low and skip counts for the day Django · PostgreSQL · Svelte · htmx · Cloudflare

The record

Line of work
Own product · sports data
Location
Remote
Role
Sole engineer
Built with
Django · PostgreSQL · Svelte · htmx · Cloudflare
Reading time
5 min read
Outcome
64% high-tier win rate
Status
Live

I The problem

Everyone posts their wins

A screenshot of a winning slip says nothing about the ones that lost. All 1,882 selections are on the board. Complete, or it is not a record.

Nobody tells you to sit out

A service that needs you playing every day cannot afford a skip tier. This one has one. It flags the games it did not want played, and 618 of them sit on the board, graded like everything else.

Picks posted before the lineups lock

A pick made before the starting pitcher is confirmed is a guess with a number attached to it. Every selection here waits for confirmed lineups and starters. Early is worth less than right.

A hot streak is not a model

A good fortnight looks exactly like a better model. Ask v8. Every pick it makes carries a version number and a date, and without those two fields nobody can say whether v9 improved anything or simply ran hot for a week.

II The solution

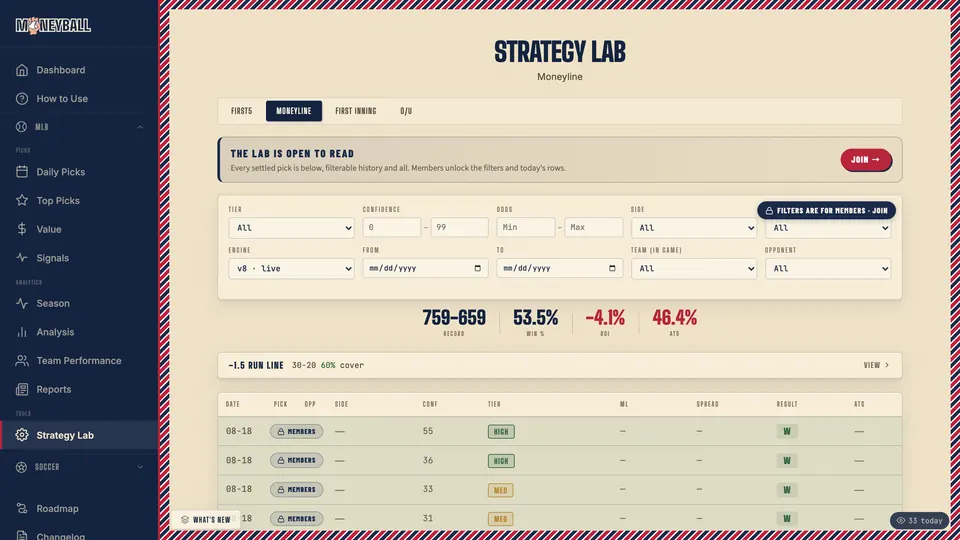
Shadow model scored against the live one, queryable per pick
Fig. 03. Shadow model scored against the live one, queryable per pick
02

Shadow model scored against the live one, queryable per pick

The Strategy Lab filters settled picks by market, tier, confidence, odds, side, result, date and team. The engine filter carries four positions: v8 live, v9 shadow, the games where the two agree, and the games where they split. A new version runs against real slates before it is allowed to pick anything. Then it earns the slot.
Confidence tiering with an explicit skip class
Fig. 02.
01

Confidence tiering with an explicit skip class

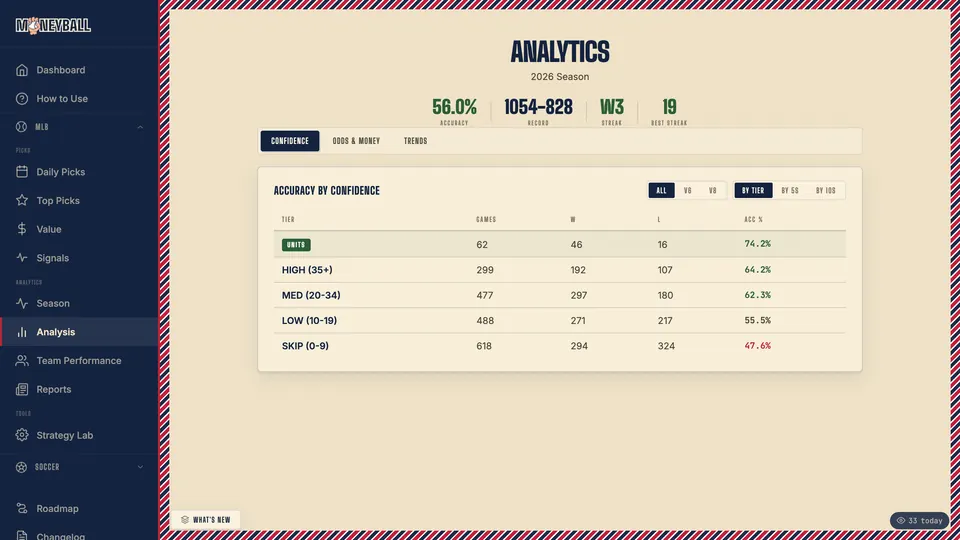
Every pick lands in one of four tiers and the model is allowed to say do not play. High runs 64.2% across 299 games. Skip runs 47.6% across 618. Both sit on the front page with their game counts attached. Check the ladder rather than believe it.

Calibration read by tier rather than by headline accuracy
Fig. 04.
03

Calibration read by tier rather than by headline accuracy

Accuracy by confidence runs 74.2% on unit plays, then 64.2%, 62.3%, 55.5% and 47.6% down through skip. The ladder is monotonic. That is the part that makes a confidence number worth printing, and the game counts next to each row are 62, 299, 477, 488 and 618.

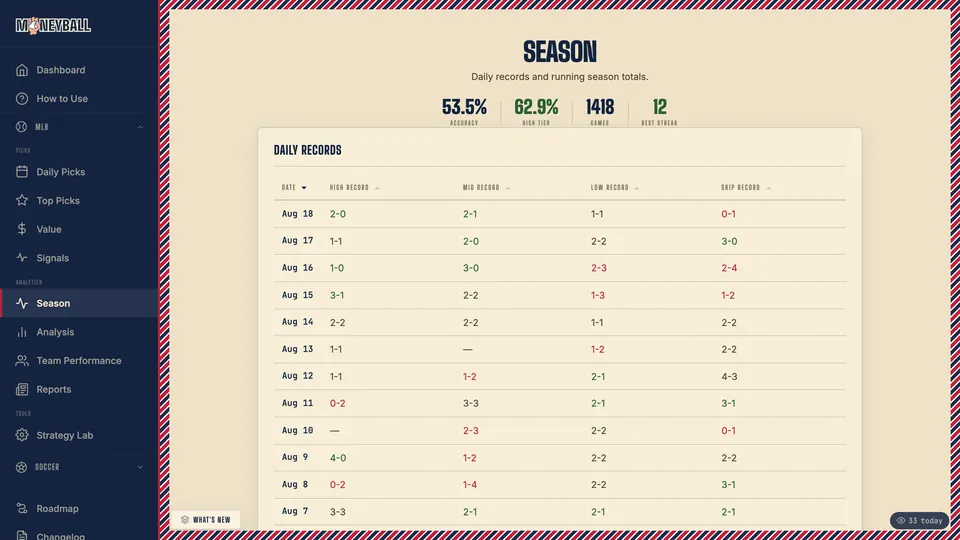
Daily records posted per tier since opening day
Fig. 05.
04

Daily records posted per tier since opening day

The season page carries one row per day, split into high, mid, low and skip, going back to May 1. Season totals read 53.5% across 1,418 games with a best streak of 12. Every selection is written the moment it is made. None are edited afterward.

Per-club backing record with flat-stake ROI
Fig. 06.
05

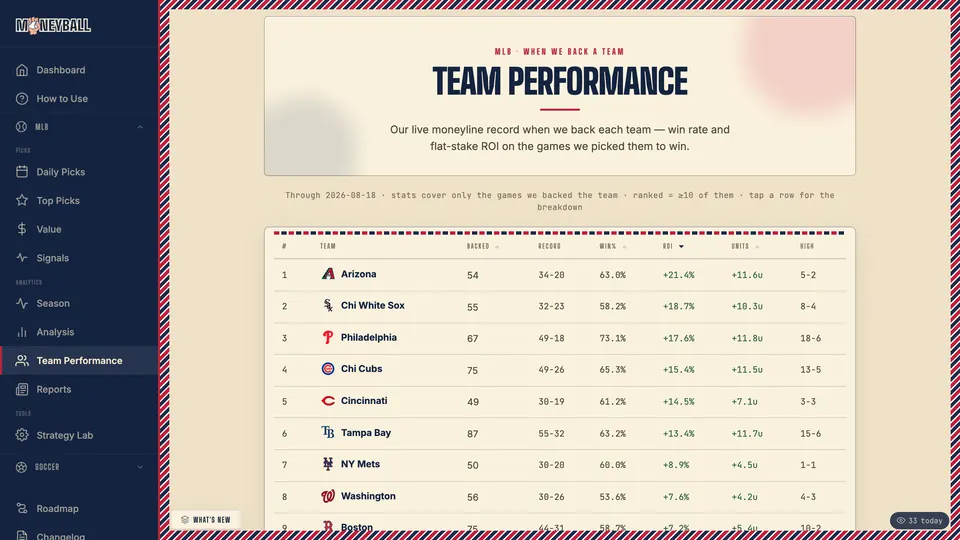
Per-club backing record with flat-stake ROI

Team Performance ranks every club by how the model did on the games where it backed them. Philadelphia sits at 49-18 across 87 games for +17.6% ROI. Arizona is 34-20 for +21.4%. Ten backings is the floor.

Versioned engines, v8 to v9, with a public change history
Fig. 07.
06

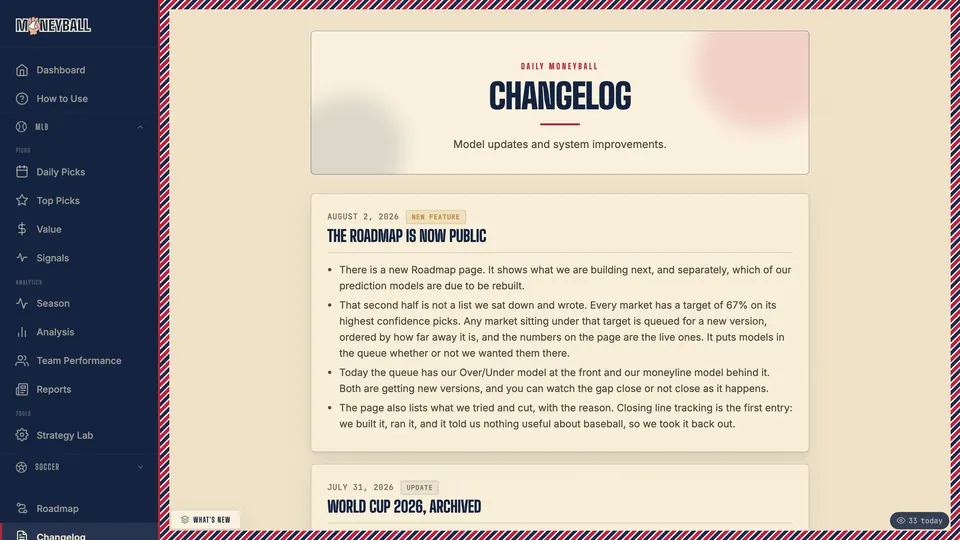
Versioned engines, v8 to v9, with a public change history

Every market carries a target of 67% on its highest confidence picks, and any market sitting under that target is queued for a rebuild. The changelog dates each one: a v9 moneyline engine in preview, the World Cup model rebuilt to v2, over/under rebuilt to v4. Closing line tracking is in there too. It did not survive. Built, run, and pulled back out once it turned out to say nothing useful about baseball.

Post-mortems on the 1.66% the model loses to the closing line
Fig. 08.
07

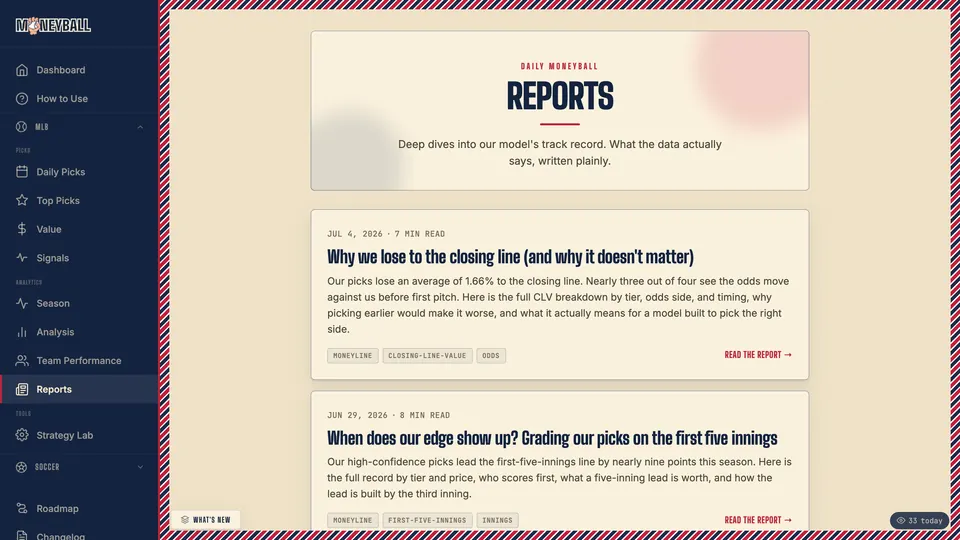
Post-mortems on the 1.66% the model loses to the closing line

Reports are long pieces on what the record actually says, published whether or not the answer flatters the model. One is titled Why we lose to the closing line. The average loss is 1.66%. Another measures where the edge shows up across the first five innings.

III The outcome

1,882
Selections logged
1,418
Games graded
64%
High-tier win rate

If you have a model in production and no way to tell whether v2 beats v1, this is the same build.

Happy to walk through this one screen by screen, in the order it got built.